Throughout its years as a part of the United States, Arizona has become known for its iconic views, resilient people, and architectural achievements such as the Hoover dam. The state is currently estimated to have a population of approximately 7,303,398 people, with steady growth over recent years. With the 14th-largest population amongst U.S. states, Arizona’s roads see a considerable amount of annual traffic, particularly in and around major cities. Our team wanted to take a closer look at the state’s traffic and crash statistics to see how safe (or risky) it is to drive on Arizona roads.
Arizona Infrastructure Statistics
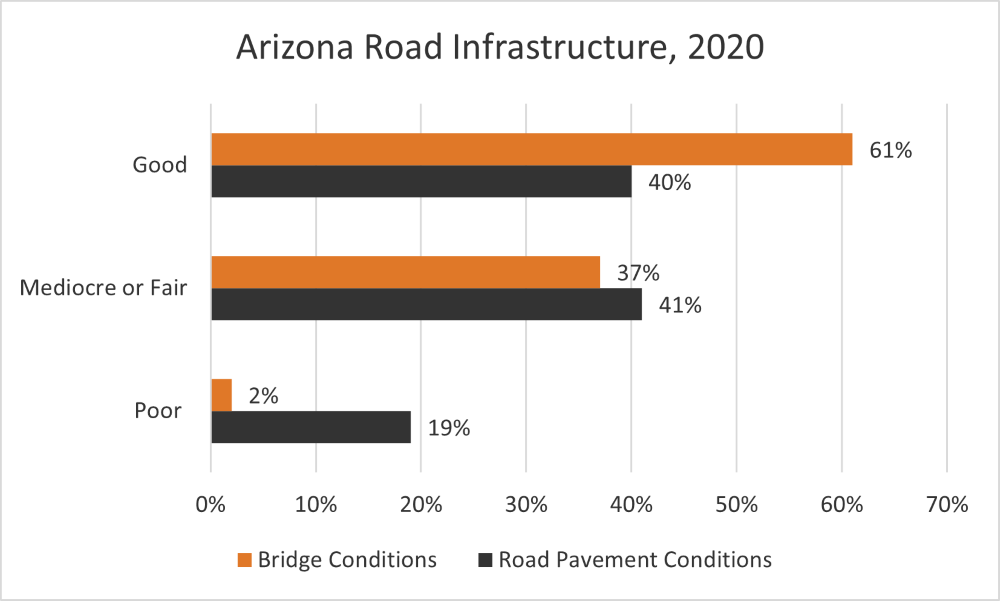
Well-designed and properly maintained engineering often means the difference between a safe roadway and a dangerous one. Using data provided by the nonprofit research organization TRIP, we took a look at the status of Arizona’s infrastructure in 2020. We specifically wanted to know whether the state’s bridges and roadways were safe for public use.
Somewhat alarmingly, 2% of Arizona’s bridges were found to be in poor or deficient condition. While this may seem like a trivial number, this translates to approximately 150 different bridges statewide showing “significant deterioration of [their] deck, supports, or other major components.” All bridges require periodic maintenance and repairs to keep them safe for use, which may be warranted at many of these sites.
Only 40% of Arizona’s roads were noted to be in good condition, with nearly one-in-five roads being marked “poor.” When evaluating road conditions, TRIP focuses on pavement quality. Potholes, rutting, rough surfaces, and other pavement defects cause a road to be marked down to “fair” quality or lower, depending on the extent of the damage. Poorly maintained roads can damage motor vehicles, are a risk to motorcyclists, and can increase collisions.
How Many Drivers & Motor Vehicles Are in Arizona?
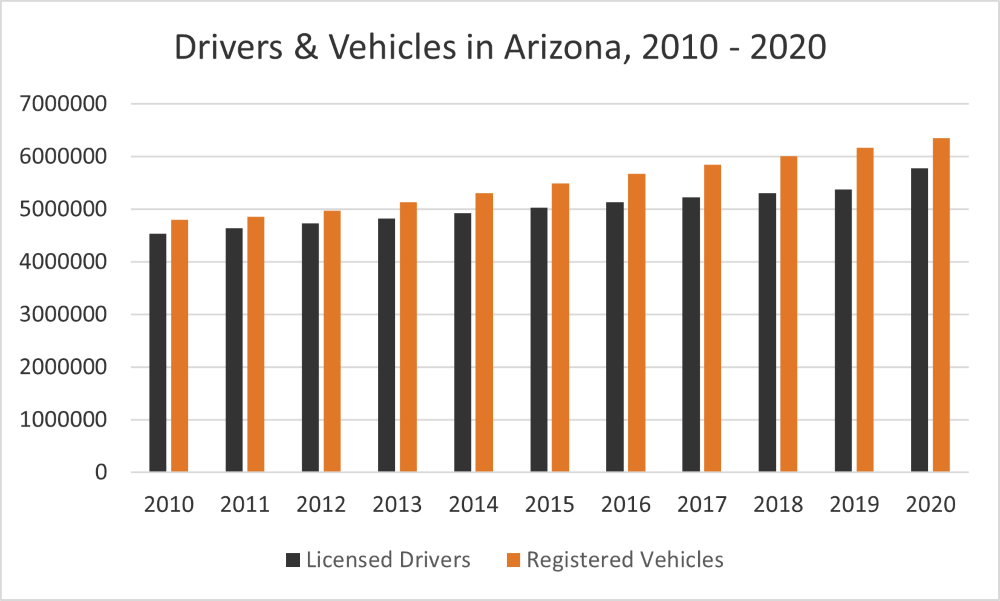
With more drivers and vehicles on the road, the risks of getting into an accident or spending a considerable amount of time stuck in traffic increase. Over an eleven-year period from 2010 to 2020, the number of licensed drivers and registered vehicles in Arizona has increased annually. In 2010, there were 4,537,653 licensed drivers and 4,805,904 registered vehicles in the state. In 2020, those numbers respectively increased to 5,772,928 and 6,356,220. That’s approximately a 21% increase in the number of drivers and a 24% increase in the number of vehicles present statewide.
How Many Accidents Occur Annually in Arizona?
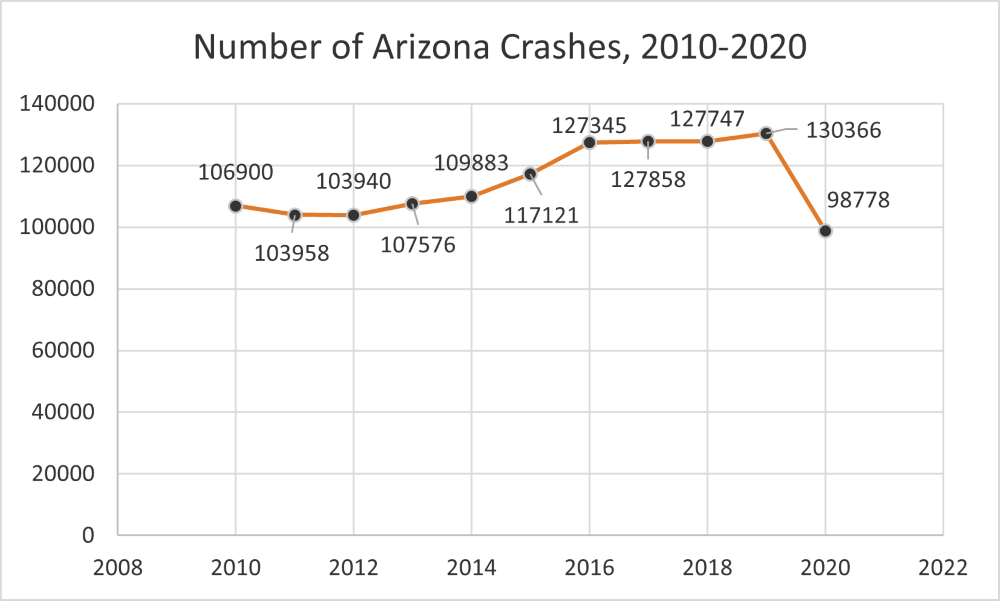
With so many cars on the road in the U.S., crashes are unfortunately inevitable to some degree. We drew upon Arizona Department of Transportation (AZDOT) data over an eleven-year period to get a better sense of how many car accidents occur in the state annually. From 2012 to 2017, the number of annual crashes rose annually, before dipping fractionally in 2018. The single year with the highest number of reported crashes followed in 2019, with 130,366 accidents. With less vehicles on the road in 2020 due to the Covid-19 pandemic, the number of annual crashes dropped by a shocking 24%.
Crash Fatality Statistics, 2010 – 2020
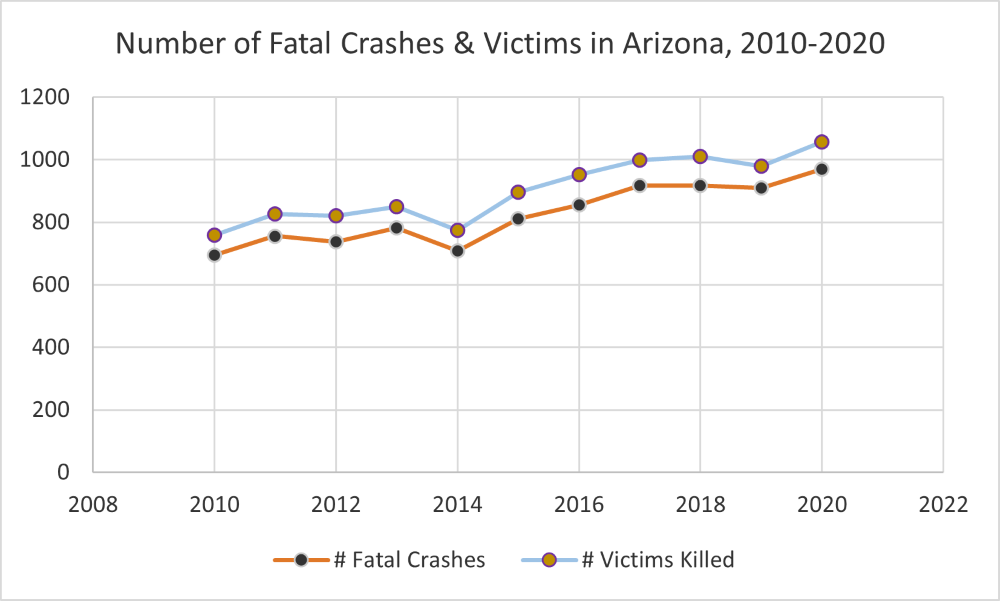
The Entrekin Law Firm notes that one metric for tracking the severity of a motor vehicle accident is whether any of the crash’s victims lost their life in the collision. In 2020, the most recent year for which full data is available through AZDOT, there were 970 reported fatal accidents. 1,057 victims lost their lives in these crashes, which is the highest number of crash-related fatalities reported in the state of Arizona since 2006 (1,301).
Overall, both fatal crashes and traffic-related deaths increased from 2014 through 2020, with a slight decrease in both metrics in 2019. The fact that fatal collisions increased in 2020 is noteworthy, as the number of vehicles on the road across the U.S. in 2020 dropped markedly from previous years. It has been theorized that the pandemic made drivers more reckless. More motorists are speeding, driving impaired, or not wearing a seatbelt.
Measuring the Economic Impact of Traffic Accidents by Arizona County
Traffic accidents have an incredible impact on the victims and their families. Even minor crash injuries can take years or decades to fully recover from, to say nothing of a victim’s losses if they are unable to work following their collision. Medical bills, vehicle repair costs, and lost income during the victim’s recovery period can be incredibly costly. While the focus is rightly on the victim and their losses, it’s important to remember that the state also suffers economic losses from car crashes. The total economic loss suffered by the state of Arizona due to collisions was approximately $17,193,012,878 in 2020.
Using AZDOT data, we display the economic losses by Arizona county below. Of note:
- Maricopa County led all Arizona counties in economic losses for all three tracked categories
- Greenlee had no economic losses from fatal accidents in 2020 and had by far the lowest overall losses, at $6,246,023
- Only three counties suffered economic losses of $30,000,000 or more for crashes that only caused property damage – La Paz, Maricopa, and Pima
| Cost of Fatalities | Cost of Injuries | Cost of Property Damage Crashes | Totals | |
| Apache | 228,368,904 | 36,942,187 | 2,467,080 | 267,778,171 |
| Cochise | 237,884,275 | 72,234,969 | 6,632,280 | 316,751,524 |
| Coconino | 409,160,953 | 169,203,551 | 18,711,360 | 597,075,864 |
| Gila | 218,853,533 | 87,695,516 | 6,258,480 | 312,807,529 |
| Graham | 142,730,565 | 30,505,950 | 2,338,920 | 175,575,435 |
| Greenlee | 0 | 5,722,703 | 523,320 | 6,246,023 |
| La Paz | 161,761,307 | 34,922,258 | 2,445,720 | 199,129,285 |
| Maricopa | 4,681,562,532 | 4,230,621,476 | 546,324,720 | 9,458,508,728 |
| Mohave | 532,860,776 | 229,270,174 | 19,565,760 | 781,696,710 |
| Navajo | 361,584,098 | 81,249,831 | 8,704,200 | 451,538,129 |
| Pima | 1,541,490,102 | 672,747,389 | 60,342,000 | 2,274,579,491 |
| Pinal | 570,922,260 | 281,309,447 | 24,179,520 | 876,411,227 |
| Santa Cruz | 66,607,597 | 10,149,247 | 1,783,560 | 78,540,404 |
| Yavapai | 608,983,744 | 279,750,607 | 24,179,520 | 912,913,871 |
| Yuma | 294,976,501 | 173,905,786 | 14,578,200 | 483,460,487 |
| Totals | 10,057,747,147 | 6,396,231,091 | 739,034,640 | 17,193,012,878 |
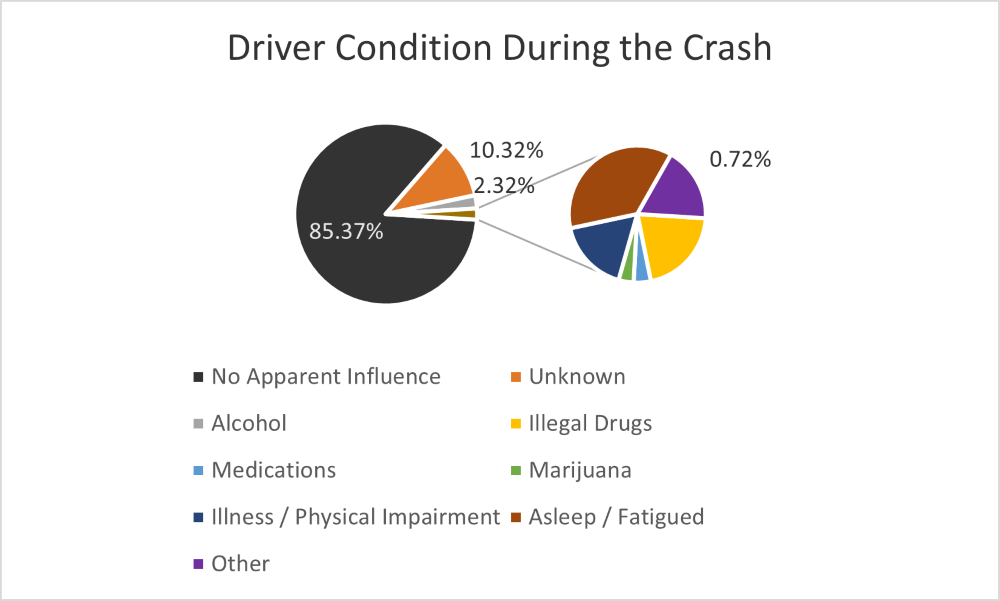
Does Impaired Driving Factor into Arizona’s Crash Statistics?
Driving impaired negatively impacts a motorist’s ability to safely use the road. Impaired drivers have slower reflexes, poorer decision making, and less control over their car, which oftentimes leads to serious crashes. The Rosenstein Law Group notes that an intoxicated driver may face a DUI arrest, license suspension, and ongoing legal troubles for driving under the influence in Arizona. We investigated the AZDOT’s 2020 data to determine the percentage of 2020 car accidents that involved an impaired or incapacitated driver.
Notable findings:
- 85.37% of 2020 crashes in Arizona did not involve an impaired or incapacitated driver
- Of all intoxicants involved in crashes, alcohol was the most prevalent (present in 2.32% of drivers involved in collisions)
- Only 0.72% of drivers involved in crashes were under the influence of illegal drugs, medications, marijuana, illness or impairment, drowsiness or sleep, or other conditions
Is Arizona a Safe State to Drive In?
Anytime you get on the road in a motor vehicle of any kind, there is an element of risk to your journey. Even the most cautious driver is at the mercy of other motorists, weather conditions, road hazards, and other uncontrollable factors. To mitigate the risks to yourself and your loved ones while driving in the state of Arizona, be sure to always practice defensive driving. Stay aware of the road around your vehicle, leave plenty of following room between your vehicle and the car in front you, and drive only when alert.