Over the past year and a half (1/1/21 – 7/31/22), the state of Connecticut had 143,735 car accidents involving 344,772 total people. 421 of these motor vehicle collisions resulted in at least one fatality, per the University of Connecticut’s (UConn) Crash Data Repository. Given that Connecticut currently has a fairly low estimated population of 3,612,314 compared to other states in the U.S., we were somewhat surprised that the region’s crash figures were so high. Our team took a closer look at the UConn collision statistics to determine the demographics of drivers, passengers, and other crash victims in the state from the start of 2021 to the present day.
How Many Crashes in Connecticut Involved Young Drivers?
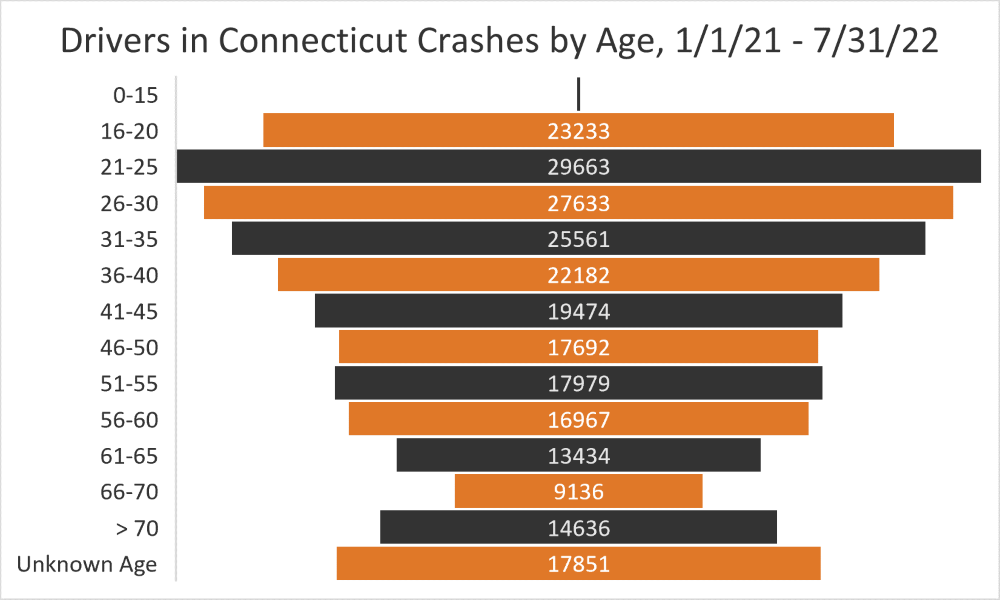
The Centers for Disease Control and Prevention (CDC) indicates that the risk of a motor vehicle crash is greatest amongst drivers aged 16-19. Furthermore, teenagers that are driving with a group of similarly aged peers are increasingly likely to get into a collision. We reviewed UConn’s crash data to determine whether that specific age range was responsible for the highest percentage of accidents in Connecticut. Surprisingly, drivers aged 16-20 were involved in only the fourth-highest number of collisions (23,233), with drivers aged 21-25 leading all other categories in terms of crash volume. So, while young motorists were still involved in a considerable number of crashes, teenagers were not the most likely to be involved in a wreck as a driver.
As drivers got older, the number of collisions decreased noticeable for the most part, with drivers aged 51-55 being an exception. However, motorists aged 70 or older were substantially more likely to be involved in a crash than drivers a few years younger.
Which Routes Are Most Dangerous for Young Drivers?
Every state has some roads, highways, and state routes that see a higher frequency of crashes than others. Lynch, Traub, Keefe & Errante note that such roads can see a higher number of collisions for multiple reasons. A road may have a defect or design flaw that makes it challenging or dangerous for drivers, such as dim lighting or sharp turns. A route can be in an area where dominant weather conditions increase the risk of collisions or visibility is limited due to geographical features. The behavior of local drivers also impacts how safe or dangerous a route is for motorists.
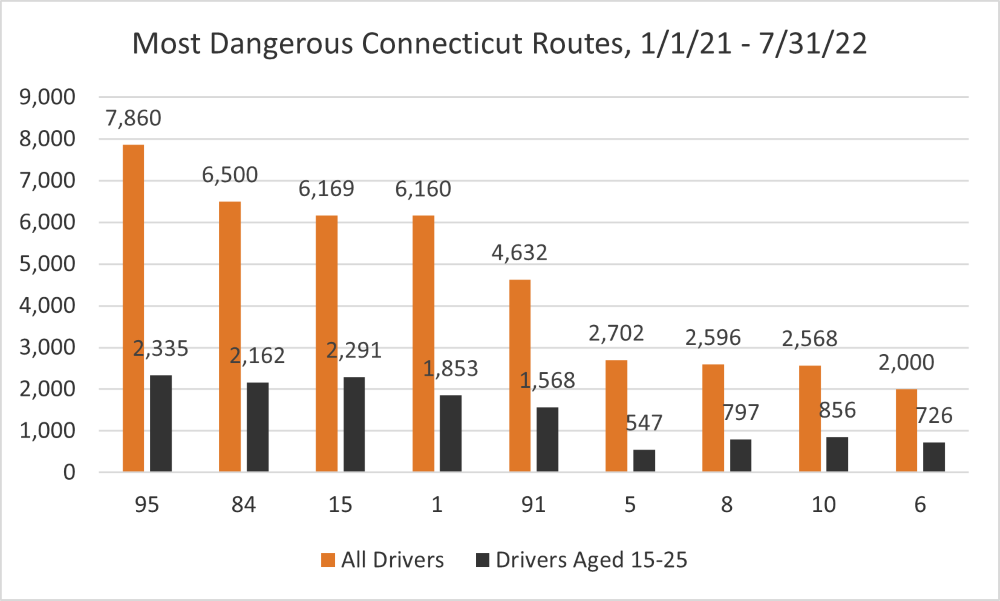
We displayed the nine Connecticut routes with the highest number of crashes below. To get a better sense of how many crashes occur on each route, we tracked both the overall number of collisions and those involving at least one young driver aged 15-to-25. The route with the most crashes overall and amongst young drivers was the portion of Interstate 95 running through Connecticut.
What Months Saw the Highest Number of Crashes Involving Young Drivers in 2021?
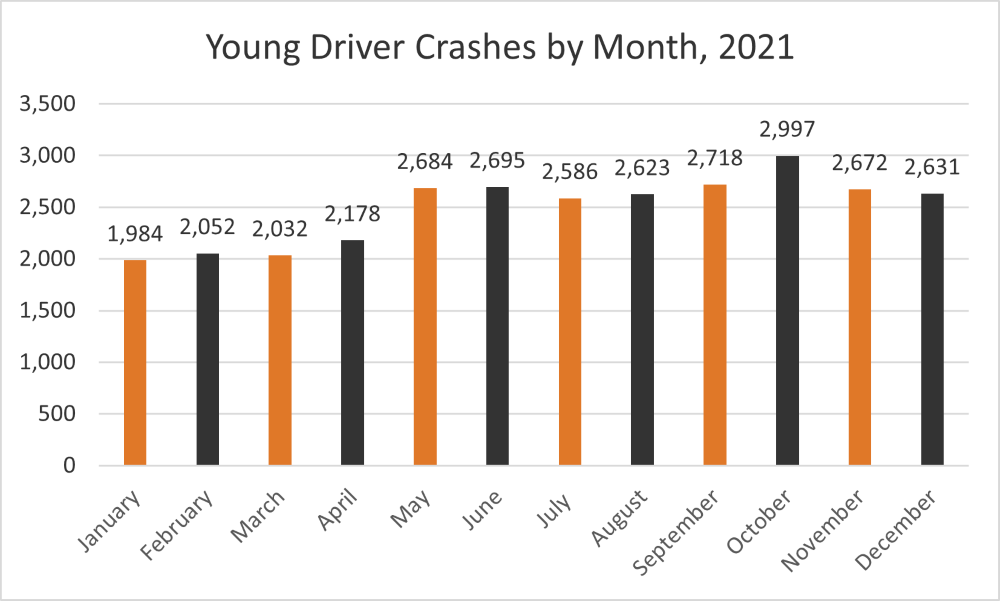
To determine whether there is a specific time of year that sees an unusual number of crashes involving young drivers in Connecticut, we pulled the UConn figures on monthly accidents in 2021. Since we are only partway through 2022, we wanted to use data from the last calendar year, to get a full sense of crash patterns in the winter months.
To our surprise, the month with the highest number of young driver crashes was October, with just under 3,000 accidents. Typically crashes increase during the summer months, particularly among young motorists, as people have more time for leisure and travel than they do throughout the rest of the year. While this was also an observable pattern in Connecticut, the continuing trend of frequent accidents in the fall was certainly unexpected.
How Many Injuries Occurred in Young Driver Crashes in Connecticut?
One metric used to judge the severity of a crash is whether at least one person was hurt, along with how serious their wounds are. We reviewed the injury reports for crashes involving at least one driver between the ages of 15 and 25 from January 1st, 2021, to July 31st, 2022. Over that period, most crashes involving young motorists resulted in no apparent injuries (approximately 84%).
Roughly 0.74% of crashes involving a younger driver resulted in a person suffering serious or fatal injuries. Over the same timeframe, the rate of fatal or serious injuries to victims amongst drivers of all ages was approximately 1.9%. In short, a driver outside of the 15-to-25 age bracket was more than 2x as likely to be involved in a crash that caused a serious or lethal injury.
| Driver | Passenger | Pedestrian | Bicyclist | |
| Fatal Injury | 91 | 22 | 8 | 1 |
| Suspected Serious Injury | 501 | 130 | 38 | 5 |
| Suspected Minor Injury | 5,471 | 1,905 | 81 | 33 |
| Possible Injury | 6,449 | 2,474 | 47 | 14 |
| No Apparent Injury | 69,174 | 21,176 | 16 | 4 |
| Unknown | 0 | 1 | 0 | 0 |
How to Practice Safe Driving as a Young Motorist
Car crashes frequently occur due to circumstances outside of the average driver’s control. Poor weather, dangerous road conditions, car problems, and the actions of other motorists can result in a nearly unavoidable accident at any given moment. To reduce the risks of a collision, it’s essential to always practice the principles of defensive driving. Avoid tailgating, stay aware of the road and vehicles around you, and always drive when alert and sober. By mitigating distractions and focusing fully on the road, you can protect yourself, your passengers, and other motorists.