In the present day, car accidents are an unfortunately frequent aspect of life. Across the United States, nearly half (43%) of first year drivers are involved in a crash. 37% of second year drivers also experience a collision, and a shocking 77% of all crashes are reportedly due to driver error, according to a Safety Insurance® study. Despite what one might think, car accidents did not decrease sharply in recent years, even as traffic and travel died down due to the early and middle stages of the COVID-19 pandemic.
In fact, evidence suggests that the pandemic made drivers across the U.S. more reckless. Motorists in 2020 and 2021 were reportedly more prone to engaging in risky behavior, such as not wearing a seatbelt, speeding, or driving impaired. The state of California saw an increase in traffic fatalities of nearly 5% in 2020, after years of progress via safety initiatives and federal programs. Given the surge in traffic-related incidents and injuries, we wanted to take a closer look at one of California’s most well-known landmarks: Los Angeles County.
Los Angeles County Motor Vehicle Facts & Figures
To immediately view the data in any of the following sections, please click the corresponding link.
Tracking Los Angeles Car Accidents by Severity
Types of Los Angeles Motor Vehicle Collisions
Breakdown of Primary Collision Factors Causing Crashes
When Did Collisions Occur Most Frequently?
Who Was Most Impacted by Collisions in Los Angeles?
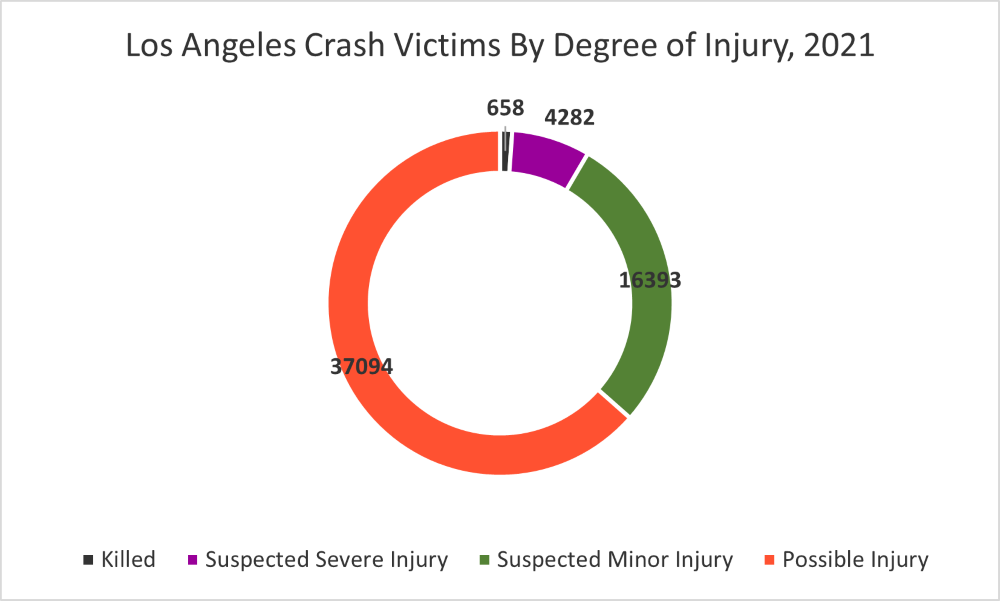
Crash Victims by Degree of Injury
Demographic of Los Angeles Crash Victims
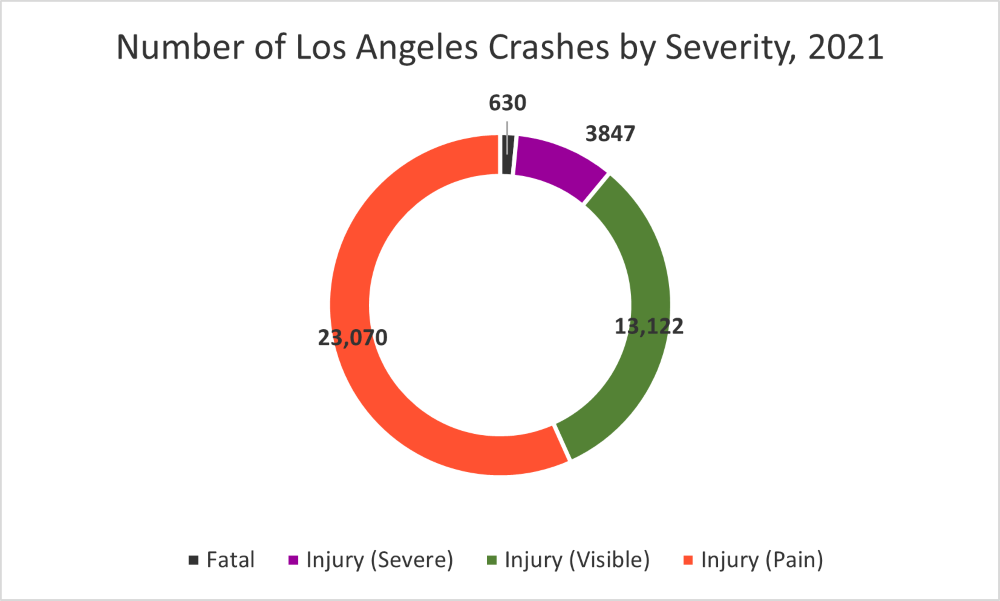
Tracking Los Angeles Car Accidents by Severity
In 2021, Los Angeles County experienced a total of 40,669 reported motor vehicle crashes. Using data provided by the Transportation Injury Mapping System (TIMS), we’re able to chart the severity of injuries reported in those collisions. Throughout the year, 4,477 motor vehicle collisions in Los Angeles County resulted in severe or fatal injuries (11.01%).
However, it’s important to keep in mind that even wounds that are not immediately life-threatening can have serious consequences. Long-term medical care, physical therapy, and emotional trauma can substantially burden a victim mentally and financially.
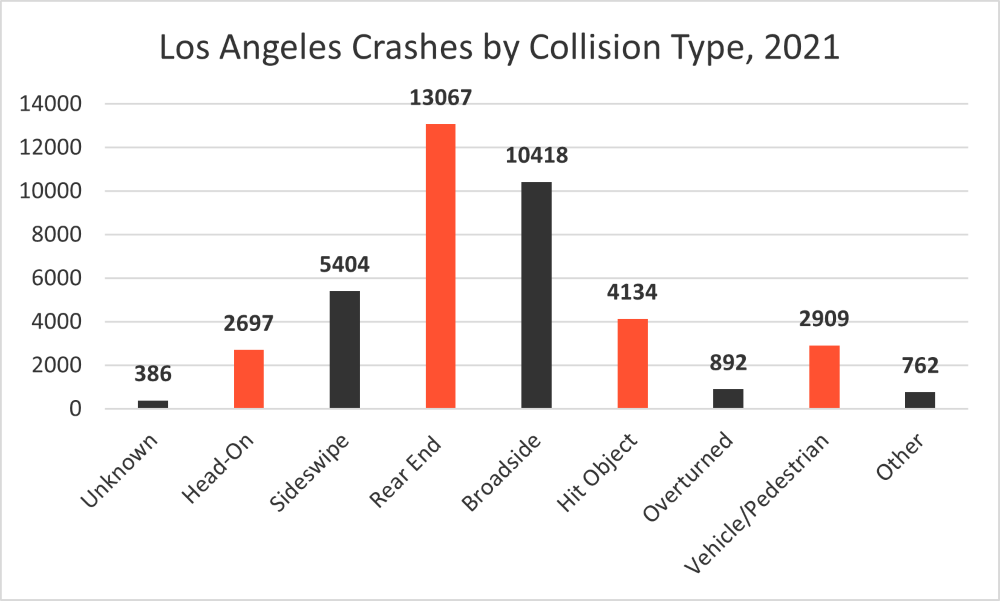
Types of Los Angeles Motor Vehicle Collisions
A car crash can occur in many ways. In some instances, a distracted driver may hit a parked car, sidewalk, or traffic signal. In others, a violent collision may occur between multiple motor vehicles. In the graph below, we break down the overall number of 2021 crashes in Los Angeles (40,669) by the type of collision.
Notable takeaways:
- Rear end collisions made up 32.13% of crashes in the county
- One in ten crashes occurs when a driver strikes an object other than a car or person
- In only 2.19% of instances did a vehicle overturn and lead to a wreck
Breakdown of Primary Collision Factors Causing Crashes
A primary collision factor (PCF) is a driving behavior or practice that frequently leads to a collision. A PCF may occur when a motorist is driving too fast for the current roadway conditions. As an example, it may be dangerous to drive the posted speed limit in heavy fog on a heavily used freeway. Other PCFs include tailgating, failure to follow traffic laws, driving impaired, and even dangerous parking. We detailed the PCFs that contributed to 2021 collisions in Los Angeles County (when known).
Noteworthy findings:
- Unsafe speed was the single highest factor causing crashes (30.96%)
- Improper turns (14.37%) and incorrectly following the right of way of another car (14.58%) caused nearly the same number of collisions, with a difference of just 81 incidents
- Only two recorded crashes were attributed to one or more motorists falling asleep behind the wheel
| PCF Violation | # Incidents | % |
| Unknown | 1,437 | 3.57% |
| Driving or Bicycling Under the Influence | 3,304 | 8.20% |
| Impeding Traffic | 15 | 0.04% |
| Unsafe Speed | 12,474 | 30.96% |
| Following Too Closely | 737 | 1.83% |
| Wrong Side of Road | 778 | 1.93% |
| Improper Passing | 230 | 0.57% |
| Unsafe Lane Change | 2,274 | 5.64% |
| Improper Turn | 5,791 | 14.37% |
| Car Right of Way | 5,872 | 14.58% |
| Pedestrian Right of Way | 1,117 | 2.77% |
| Pedestrian Violation | 1,134 | 2.81% |
| Traffic Signs & Signals | 3,603 | 8.94% |
| Dangerous Parking | 17 | 0.04% |
| Lights | 5 | 0.01% |
| Brakes | 6 | 0.01% |
| Additional Equipment | 20 | 0.05% |
| Other Hazardous Violation | 285 | 0.71% |
| Non-Driver or Pedestrian | 496 | 1.23% |
| Unsafe Starting / Backing | 551 | 1.37% |
| Other Improper Driving | 138 | 0.34% |
| Falling Asleep | 2 | 0% |
When did Collisions Occur Most Frequently?
A car crash can occur at any moment if there are motorists on the road. However, some windows of time historically have a higher risk of traffic-related incidents than others. In the table below, we track the times in which Los Angeles County crashes occurred.
Somewhat surprisingly, most collisions do not occur in the early morning, when people are commuting to work, or late at night. The timeframe with the most accidents was 09:00-11:59, with 15,398 recorded crashes. 15:00-17:59 is a distant second, with 8,552 reported collisions. More incidents occurred between Friday and Sunday (6,061) than between Monday through Thursday (5,622).
| Monday | Tuesday | Wednesday | Thursday | Friday | Saturday | Sunday | |
| 25:00 – Unknown | 5 | 4 | 5 | 7 | 5 | 5 | 7 |
| 21:00 – 23:59 | 492 | 496 | 596 | 593 | 826 | 839 | 680 |
| 18:00 – 20:59 | 813 | 918 | 934 | 980 | 1,203 | 958 | 938 |
| 15:00 – 17:59 | 1,217 | 1,256 | 1,303 | 1,227 | 1,446 | 1,089 | 1,014 |
| 12:00 – 14:59 | 944 | 978 | 948 | 969 | 1,133 | 1,024 | 850 |
| 09:00 – 11:59 | 680 | 678 | 747 | 746 | 725 | 730 | 626 |
| 06:00 – 08:59 | 674 | 698 | 715 | 706 | 655 | 415 | 311 |
| 03:00 – 05:59 | 293 | 280 | 238 | 240 | 302 | 332 | 402 |
| 00:00 – 02:59 | 338 | 218 | 260 | 291 | 339 | 613 | 715 |
| Total Per Day | 5,456 | 5,526 | 5,746 | 5,759 | 6,634 | 6,005 | 5,543 |
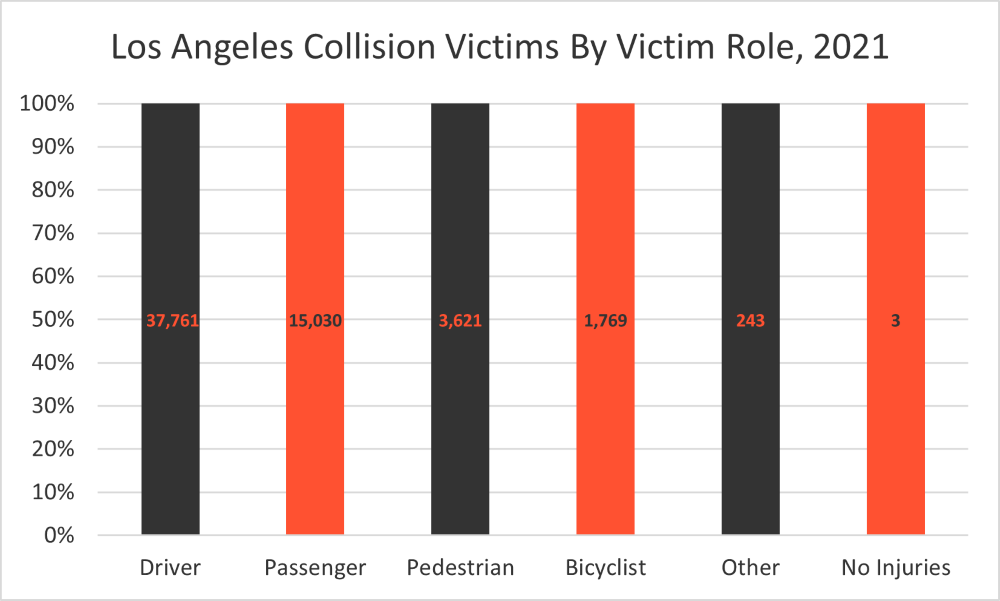
Who Was Most Impacted by Collisions in Los Angeles?
Every car crash is unique. The circumstances leading up to the situation, numbers of victims involved, and outcome vary depending on multiple factors. We wanted to discover who bore the brunt of crash-related injuries and damages in Los Angeles.
Our team learned that drivers were 1.83x more likely to be the victim of an accident than any other person. Since all crashes must involve at least one driver and many collisions only involve one vehicle, this statistic makes sense. Meanwhile, passengers were 2.79x more likely to suffer damages or harm than bicyclists or pedestrians.
To make the data easily visible, we adjusted the following graph for scale to prevent the “other” and “no injuries” columns from being dwarfed by the more sizeable datapoints.
Crash Victims by Degree of Injury
In 630 fatal crashes throughout the year, 658 victims lost their lives. A further 4,282 collision victims are believed to have suffered severe injuries and 53,487 victims received either minor or possible harm. Overall, 58,427 people were directly impacted by a motor vehicle accident in Los Angeles County during 2021.
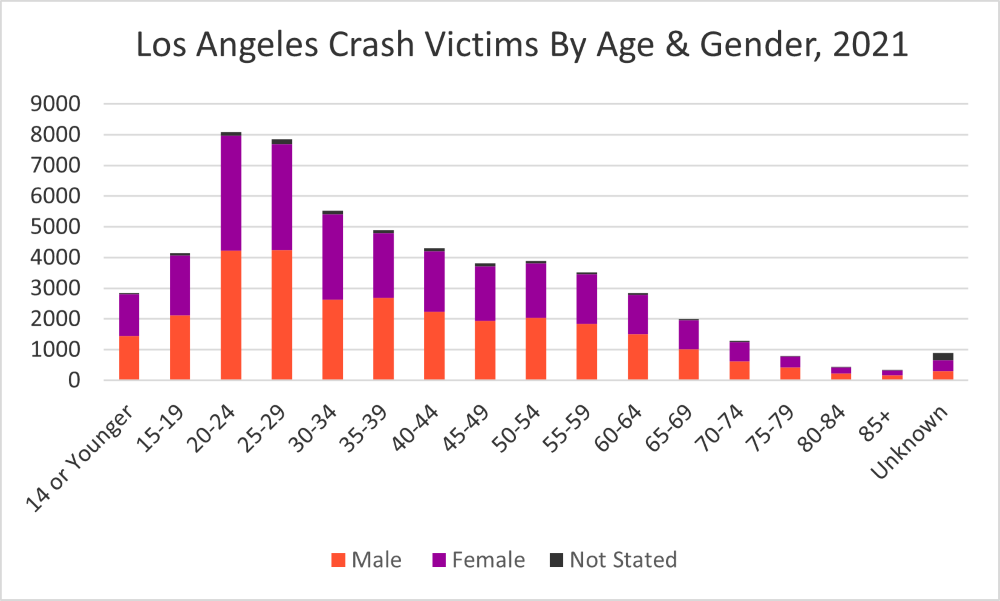
Demographic of Los Angeles Crash Victims
In the previous section, we established that 58,427 people were involved in Los Angeles County crashes in 2021. To further breakdown this figure, we tracked the genders and ages of collision victims.
Noteworthy statistics:
- Approximately 52% of accident victims were male, 45% were female, and the victim’s gender was unknown in 2% of cases
- Middle-aged people encountered the most car accidents, with the age ranges 20-24, 25-29, and 30-35 making up 38.45% of all victims
- Only 4.89% of accidents involved a victim aged 70 or older